Usage
The Usage screen shows how much the operation consumed of each of the rule's sub-products in the current month: charges created, messages sent per channel, protests, credit bureau registrations, and the account's current size. It is Dunning's consumption reading, the same basis that feeds billing by sub-product.
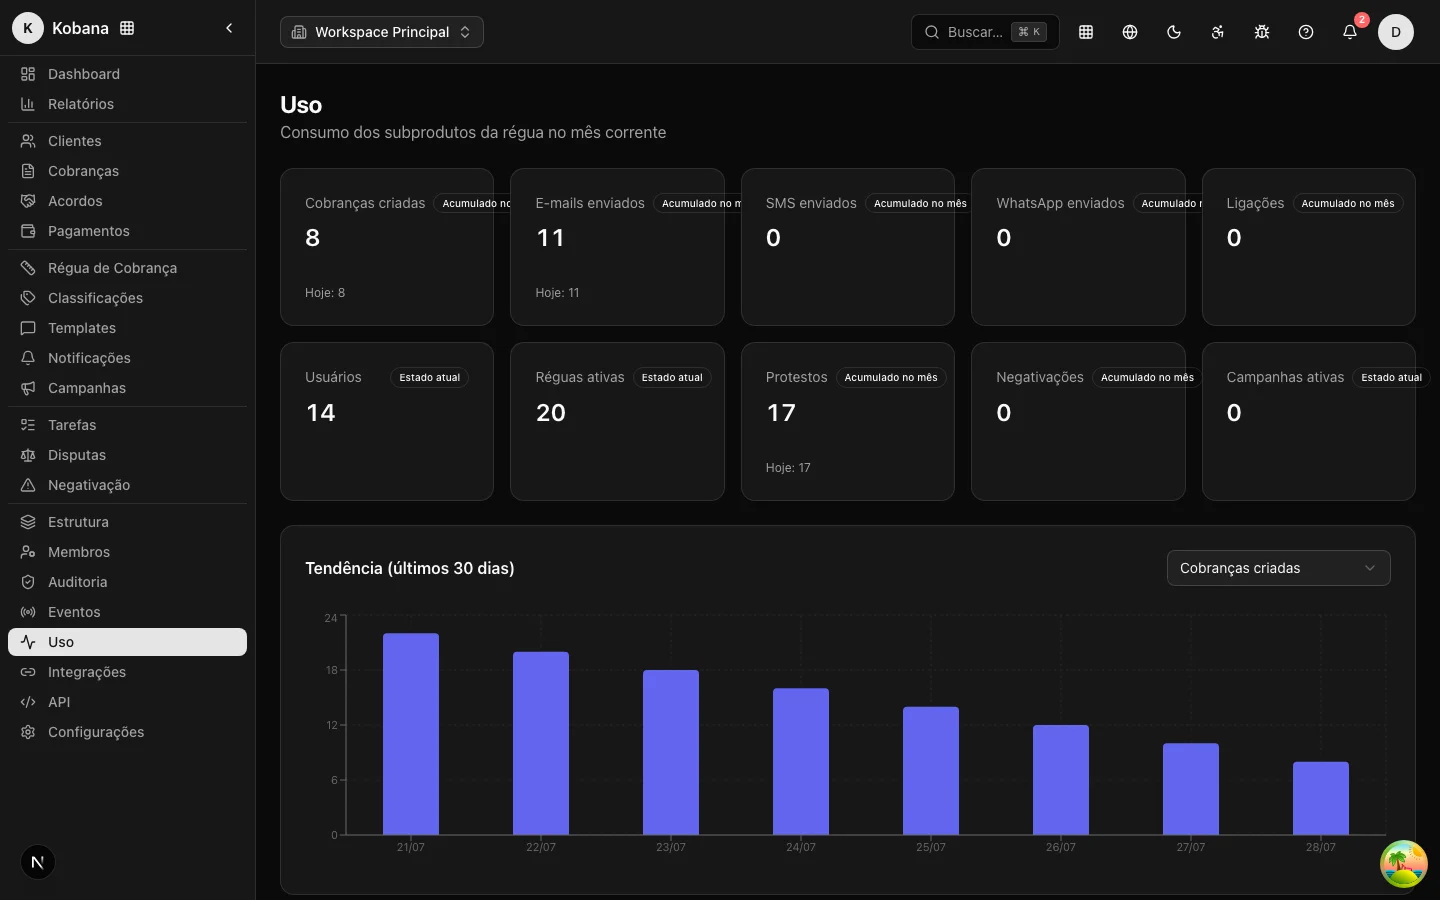
Two natures of metric
The system splits metrics into two types, and how you read each card depends on that:
- Event (accumulates over the month): each occurrence counts and adds up across the days. The card shows the month-to-date total prominently and the day's value just below. They are: charges created, emails sent, SMS sent, WhatsApp sent, calls, protests, and credit bureau registrations.
- Current state (gauge): a snapshot of the moment, which makes no sense to add up. The card shows only the current value, with no "today". They are: users, active rules, and active campaigns.
The badge in the corner of each card says which is which ("Month to date" or "Current state"), so there is no doubt about what that number represents.
The metrics
| Metric | Type | What it counts |
|---|---|---|
| Charges created | Event | Charges born during the day, from any origin. |
| Emails sent | Event | Notifications sent through the email channel. |
| SMS sent | Event | Notifications sent by SMS. |
| WhatsApp sent | Event | Notifications sent by WhatsApp. |
| Calls | Event | Notifications from the voice channel (legacy — new steps cannot configure voice). |
| Protests | Event | Protests recorded during the day. |
| Credit bureau registrations | Event | Credit bureau registrations recorded during the day. |
| Users | Current state | Account users. |
| Active rules | Current state | Collection rules configured and activated. |
| Active campaigns | Current state | Active negotiation campaigns. |
Sends per channel come from notifications actually sent; rules and campaigns count only those that are activated.
Beyond the cards, the same daily process computes three outcome metrics that feed sub-product billing (no card of their own on this screen yet): charges recovered (recovery records created during the day), agreements closed (agreements accepted during the day) and disputes opened (disputes recorded during the day).
The trend chart
Below the cards there is a bar chart with the last 30 days' trend of the selected metric. Use the selector in the corner of the card to switch the metric: you can see the daily volume of emails, the pace of charge creation, or the evolution of any other. Each bar is that day's value (not the cumulative), so the chart shows the real, day-by-day pace.
Where the data comes from
The numbers are not calculated the moment you open the screen. A daily process runs in the early morning (04:30) and records, per account and per metric, the previous day's volume and the month-to-date total. Because of that:
- A freshly created account shows the message that there is no data yet; the cards start to populate after the process's first run.
- Today's consumption only shows up tomorrow, when the process closes the previous day in the account's time zone.
That same process is the source of each sub-product's billable consumption, so the screen's numbers and the billing numbers tell the same story.