Reports
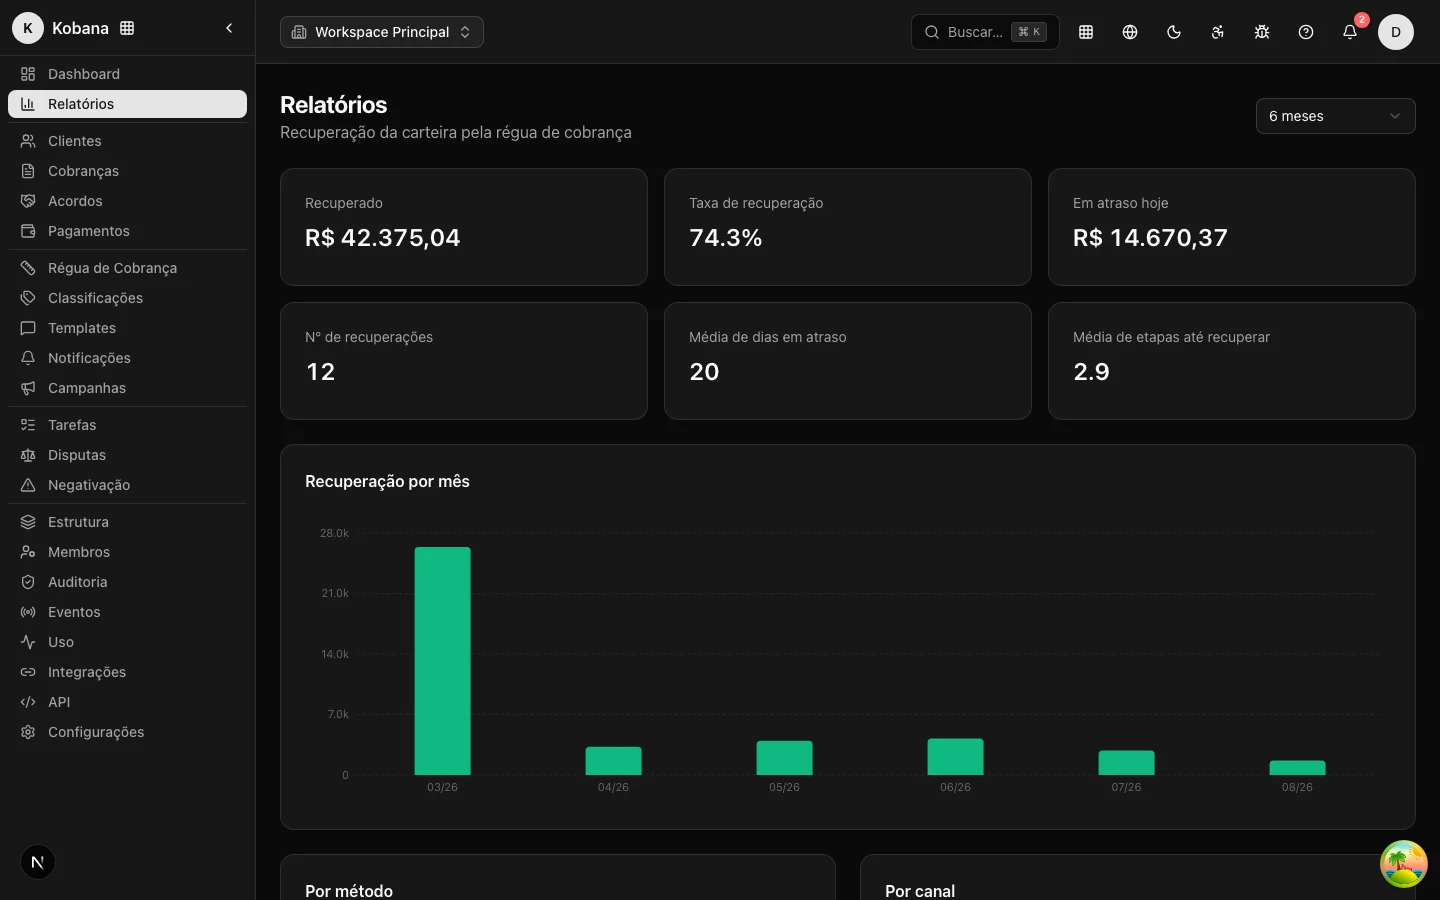
The Reports screen is the operation's outcome reading: how much the rule recovered, at what rate, and through which paths. It consolidates onto a single page the recovery KPIs, the month-by-month evolution, and the breakdowns by method and by channel, all over the period you choose.
The methodology behind each number (what counts as recovery, how attribution by method and channel works) is detailed in Recovery. This page describes the screen.
The period selector
At the top, a selector defines the data window: 3, 6, or 12 months. All the KPIs, the chart, and the breakdowns respect this period. The default is 6 months.
The recovery KPIs
Six cards summarize the period:
- Recovered — total amount recovered.
- Recovery rate — the fraction of the portfolio that returned to cash. A conservative reading: the denominator includes everything still overdue today.
- Overdue today — the amount still overdue right now (the rate's live denominator).
- Number of recoveries — how many charges were recovered.
- Average days overdue — how many days, on average, charges had been overdue when they were paid.
- Average steps to recover — the rule's average effort per conversion.
When there is no data for an indicator in the period, the card shows a dash instead of forcing a number.
Recovery by month
The chart shows the amount recovered month by month within the period, with the recovery count. It is the trend reading: rising bars indicate an operation recovering more over time.
Breakdowns by method and by channel
Two tables, side by side, break down the total recovered:
- By method — how much came from the rule, from agreements, and from overdue charges without a rule. It separates the outcome of the collection work from what was negotiated or resolved through other paths.
- By channel — how much each channel (email, SMS, WhatsApp) converted as the last touch before payment.
Each row carries the amount and the count. If there is no recovery in the period, the table shows that there is no data.